Here is a comparison of average unit prices in the months of January 2022 vs May 2023:
| Product Category | Jan 22 | May 23 | % Decline |
|---|---|---|---|
| DRINKS | $18 | $13 | -28% |
| EATS | $22 | $20 | -9% |
| EXTRACTS | $32 | $29 | -9% |
| FLOWER | $41 | $36 | -12% |
| PREROLLS | $20 | $18 | -10% |
| TABLETS/CAPSULES | $39 | $35 | -10% |
| TINCTURES | $47 | $38 | -19% |
| TOPICALS | $39 | $36 | -8% |
| VAPES | $37 | $32 | -14% |
Prices Across All Orgs
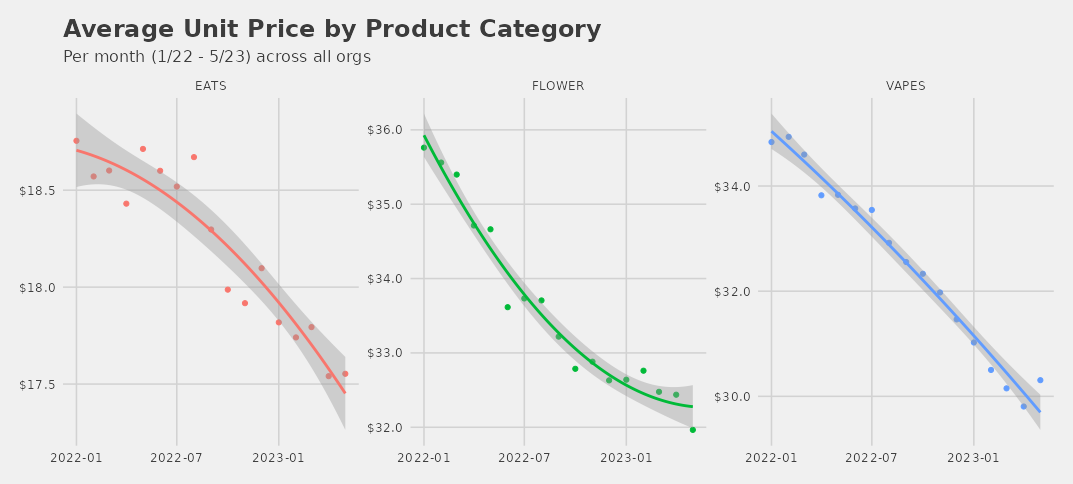
As a whole, the average unit price across most categories have been on the decline since the start of 2022. The three largest categories in the market are (1) Flowers, (2) Vapes, and (3) Edibles. The plot below shows the average unit price of these product categories. We can observe the decline is most significant with vapes, followed closely by flower, then less dramatically with edibles.

Analyzing Vape Product Prices
As an example of the analysis we do internally, I’ve decided to focus on Vapes to highlight our findings.
Looking deeper at the price of vapes, I analyzed and found that 57 total orgs had a statistically significant upward or downward trajectory. Of those 57, the majority had declining prices (49). For those 49 organizations, the following chart shows the average monthly price since January 2022.

A Look at Other Categories
The chart below highlights all product category prices over time. As can be seen, only two categories have no declining trajectory in average product price.
